Introduction:
Microsoft 365 Copilot Wave 2 brings a powerful new feature to Excel: the integration of Python. This update is set to revolutionize data analysis by combining the robust capabilities of Python with the familiar interface of Excel. Whether you’re a data scientist, financial analyst, or business professional, Python in Excel opens up new possibilities for data manipulation, analysis, and visualization.
What is Python in Excel?
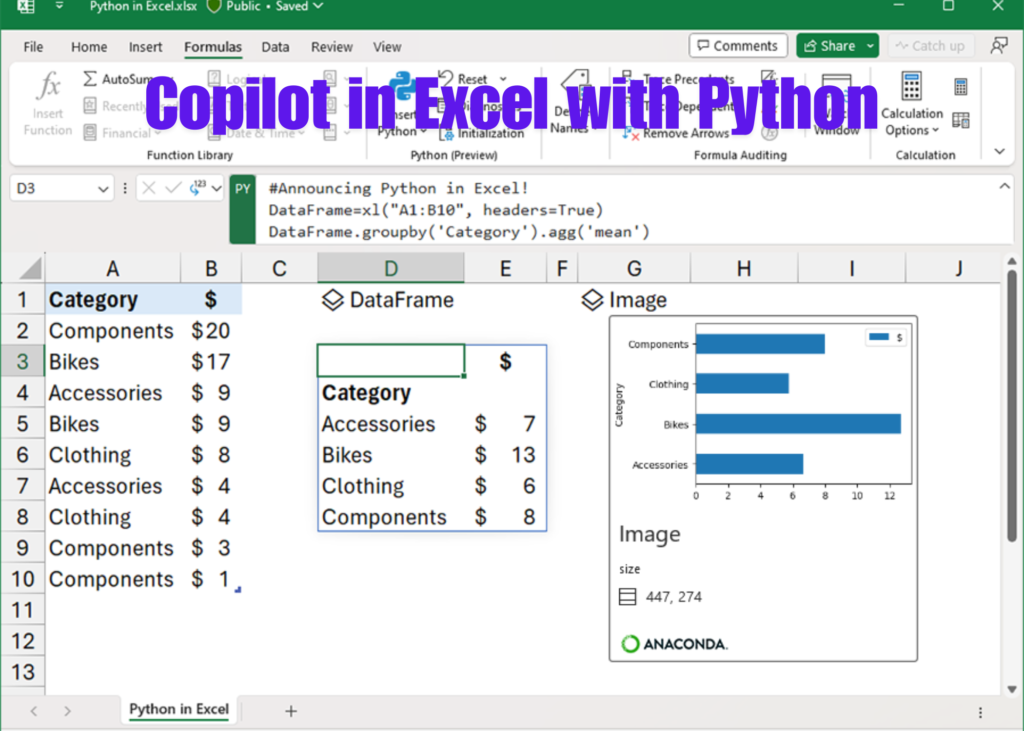
Python in Excel allows users to run Python scripts directly within Excel, leveraging Python’s extensive libraries and functions for advanced data analysis. This integration bridges the gap between Excel’s user-friendly interface and Python’s powerful data processing capabilities.
Key Features of Python in Excel:
- Seamless Integration:
- Python scripts can be executed within Excel cells, allowing for seamless interaction between Excel formulas and Python code.
- Example: A financial analyst can use Python to perform complex calculations and then display the results directly in Excel.
- Access to Python Libraries:
- Users can access popular Python libraries such as Pandas, NumPy, and Matplotlib, enabling sophisticated data manipulation and visualization.
- Example: A data scientist can use Pandas to clean and transform data, and then use Matplotlib to create detailed charts and graphs.
- Enhanced Data Analysis:
- Python’s advanced data analysis capabilities complement Excel’s existing features, providing a more comprehensive toolkit for data professionals.
- Example: A business analyst can use Python to run statistical analyses and machine learning models on large datasets.
Must read: Microsoft Unveils SpreadsheetLLM: Revolutionizing Data Analysis and Enterprise Productivity
Benefits of Using Python in Excel:
- Advanced Data Manipulation:
- Python’s powerful data manipulation libraries allow for more complex and efficient data processing than Excel alone.
- Example: Automating data cleaning processes that would be time-consuming to perform manually in Excel.
- Improved Data Visualization:
- Python’s visualization libraries offer more customization and flexibility for creating detailed and informative charts.
- Example: Creating interactive and dynamic visualizations that can be embedded in Excel reports.
- Increased Productivity:
- The integration of Python in Excel streamlines workflows by reducing the need to switch between different tools for data analysis.
- Example: Performing all data analysis tasks within Excel, from data import to final visualization, without needing to export data to a separate Python environment.
Quotes and Insights:
“Integrating Python with Excel is a game-changer for data professionals,” said a Microsoft executive. “This feature combines the best of both worlds, making advanced data analysis more accessible and efficient.”
Use Cases:
- Financial Analysis:
- Financial analysts can use Python to automate complex financial models and calculations, improving accuracy and efficiency.
- Data Science:
- Data scientists can leverage Python’s libraries for data cleaning, transformation, and analysis, all within the familiar Excel environment.
- Business Intelligence:
- Business analysts can create more detailed and interactive dashboards by combining Excel’s data handling capabilities with Python’s visualization tools.
Getting Started with Python in Excel:
- Set Up:
- Ensure you have the latest version of Excel with Python integration enabled.
- Install any necessary Python libraries using the built-in package manager.
- Writing Python Scripts:
- Write Python scripts directly in Excel cells using the new Python function.
- Example:
=PYTHON("import pandas as pd; df = pd.read_csv('data.csv'); df.describe()")
- Combining Excel and Python:
- Use Excel formulas and Python scripts together to create powerful data analysis workflows.
- Example: Use Excel to import data, Python to process it, and Excel again to visualize the results.
Conclusion:
The integration of Python in Excel as part of Microsoft 365 Copilot Wave 2 is a significant advancement for data professionals. By combining Python’s powerful data analysis capabilities with Excel’s user-friendly interface, this feature enhances productivity, efficiency, and the overall data analysis experience. As data continues to play a crucial role in decision-making, Python in Excel offers a versatile and powerful tool for professionals across various industries.
Call to Action:
We invite you to share your thoughts and experiences with Python in Excel in the comments section or on social media. How do you think this new feature will impact your data analysis workflows? For more information and related articles, check out the links below.

